

0


| Thumbs Up |
| Received: 5,410 Given: 6,858 |
ROSALIND M. HARDING AND ROBERT R. SOKAL
Classification of the European language families by genetic distance
(human variation/gene frequencies)
Proc. Nati. Acad. Sci. USA Vol. 85, pp. 9370-9372, December 1988
Population Biology
Department of Ecology and Evolution, State University of New York at Stony Brook, Stony Brook, NY 11794-5245
Contributed by Robert R. Sokal, August 24, 1988
Average genetic distance matrix among language families:
Average genetic distance from Turkic group:
INTRODUCTION
The citation below from the Proceedings of National Academy of Sciences article provides a graphic illustration of the relationship between the genetical composition of a category of population, and its linguistic classification. While they are generally presumed to mutually correlate, and that implicit or assumed correlation is laid in the foundation of some reconstructive historical hypotheses, the study explicated in the article demonstrates the effects of the linguistic conversions of entirely opposite nature.
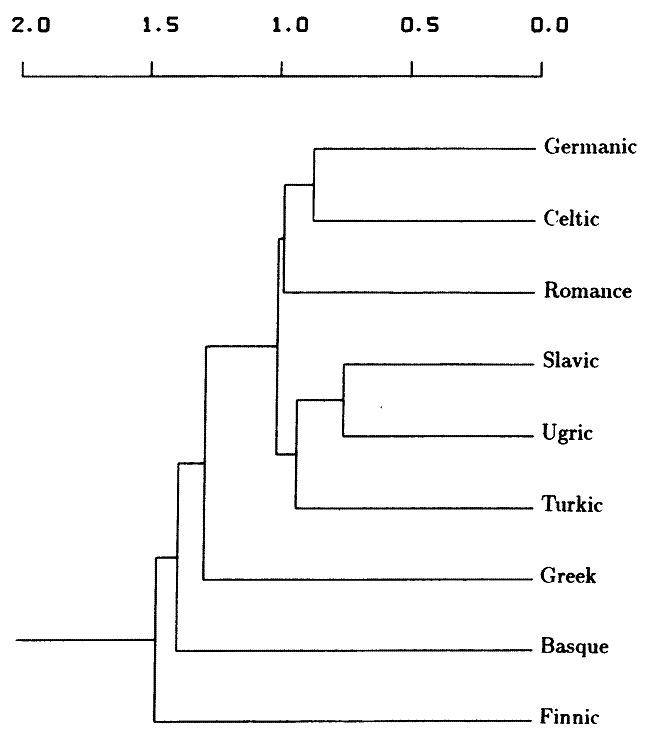
The study revealed that the peoples presently speaking Slavic, Ugric and Türkic languages constitute one genetic distinct group (Fig. 1). This is consistent with the concept that the present speakers of Slavic language genetically are predominantly Slavisized Finno-Ugrians and Turks. A further study of the Northern Slavic and Southern Slavic subdivisions in Eastern Europe would illustrate that the Northern Slavic populace is genetically connected with the Finno-Ugric group, and the Southern Slavic populace is genetically connected with the Türkic group. The carriers of the European "Indo-European" German, Celtic and Roman languages also constitute a separate distinct group (Fig. 1). Timewise, the geographical spread of the Slavic language is consistent with the advance of the Slavic colonization in the Northern and Southern parts of the Central and Eastern Europe during the last millennia. The genetic aspect of the colonization is manifested in that the "genetic distances of some interphylum language-family pairs, such as those between Slavic and Ugric speakers, or between Turkic and Ugric speakers, however, are closer than some distances within a phylum, as between Greek and Celtic speakers or between Finnic and Ugric speakers."
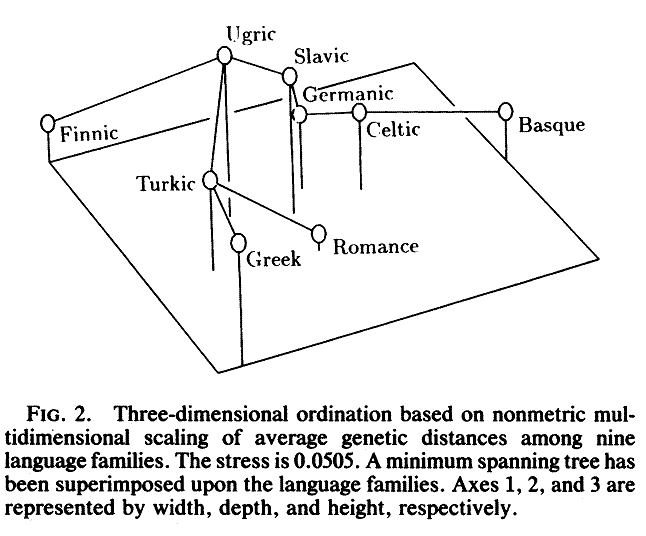
The clustering of the genetically closest Slavic-Ugric and Greek-Türkic (Fig. 2) pairs may indicate the processes of the Proto-Baltic and Proto-Greek periods, when the Baltic predecessors of the Proto-Slavs, and the later Proto-Slav splinter themselves had a close genetic connection with the Finno-Ugrian population in the Northern Europe, and Türkic population in the Southern Europe, and when the Greek predecessors and later ancient Greeks had a close genetic connection with the Türkic Scythian and later Sarmatian population in the Southern Europe.
The seemingly non-concordant genetical links should be, and for better studied cases are, detectable through the linguistic influences. Some of these cases are widely known, like the heavy layer of Türkic lexicon in the Russian language, the others have not been studied specifically or impartially, and may be helped by the indications of the genetical proximity.
RESULTS
Fig. 1 shows the hierarchic clustering of genetic distances for 9 language families. A Germanic-Celtic cluster is joined later by Romance, and a Slavic-Ugric cluster is joined by Turkic. Finnic, Basque, and Greek are outliers to these clusters. Including Albanian, Baltic, and Semitic in the analysis changes the phenogram by affiliating Greek with Albanian, Baltic with Turkic, and clustering Germanic-Celtic with Slavic-Ugric before adding Romance. Semitic, Basque, and Finnic are outliers to the clusters of 12 language families.
An ordination of the genetic distance matrix (Fig. 2) depicts the relative genetic distances between the nine language families. Finnic and Basque are outliers at opposite ends of the ordinated space. The Celtic-Germanic and Slavic-Ugric language-family pairs are evident along the first axis which runs roughly East-West. The second axis approximates a North-South gradient. In the minimum spanning tree, Turkic links Ugric and Greek with Romance. The position of Romance is central on the first and second axes, but isolated by the third, explaining its variable affiliation during clustering.
Genetic distance (Gen) correlates significantly with geography (Geo) but not with language (Lan). The pairwise correlations of distance matrices based on nine language families are as follows: Gen x Geo = 0.468 (P < 0.01), Gen x Lan = 0.182 (P>0.05), and Geo x Lan = 0.177 (P>0.05). The partial correlations are (Gen x Geo)-Lan = 0.451 (P < 0.01) and (Gen x Lan)-Geo = 0.114 (P > 0.05). Geography determines 20.3% of the variance of the genetic distances, language determines only 1.0%o, and factors common to geography and language determine 1.6%.
One might have expected a high and significant Gen x Lan correlation, because speakers of a particular language (family) tend to be found settled near each other. In other words, when geographic distances between samples are small we expect linguistic distances to be small, and vice versa. If geography is likewise correlated with genetics, then genetic and linguistic distances should also be positively correlated. But the Geo x Lan correlation in this study is low because centers of language phyla are positioned in Europe both relatively close and far apart spatially causing the relationship between geography and language to break down. Therefore, the common effect of geography does not produce a high correlation between genetics and language. This finding contrasts with the significant correlation between genetic and language distances reported by Sokal (5). In that study correlations among genetics, linguistics, and geography were calculated for pairwise locality distances. Since a finer scale of distances was used, both the correlation of geography and of language and the common effect of geography were greater.
DISCUSSION
This study shows that genetic distances between the European language families do not reflect their accepted linguistic relationships. If we group the language families by their linguistic origins, there should be a cluster of the Indo- European language families, Baltic and Slavic being most closely related, a separate branch for the Finnic and Ugric speakers, and separate coordinate branches for the Turkic, Semitic, and Basque language families. The genetic distances of some interphylum language-family pairs, such as those between Slavic and Ugric speakers, or between Turkic and Ugric speakers, however, are closer than some distances within a phylum, as between Greek and Celtic speakers or between Finnic and Ugric speakers. The low matrix correlation between genetics and language confirms the lack of agreement between presumed language phylogeny and the observed genetic distances.
If genetic distances reflect geographic proximity, we should be able to predict genetic affinity from a clustering of the great-circle distances between language families. This yields Germanic-Celtic and Romance-Basque as mutually closest pairs, with the two pairs together forming a major cluster. Likewise, Slavic-Ugric and Greek-Turkic both cluster as pairs. Finally, Finnic is an outlier. Clustering all 12 language families by great-circle distance enlarges the Greek- Turkic cluster into one that also includes Albanian and Semitic and places Baltic-Finnic as an outlying pair. Considerable concordance between geographic proximity and observed genetic relations is evident and confirmed by the significant correlation between geographic and genetic distances. The role of geography can also be seen in the ordinations. Disregarding the outliers, Fig. 2 demonstrates an East-West separation of geographically adjacent language family pairs, Germanic-Celtic from Turkic-Greek with Slavic- Ugric intermediate. The small Greek-Albanian genetic distance is also consistent with geographic proximity, although we attach less confidence to this value. The observations made here are supported by a largely geographic clustering of European map quadrats characterized by gene frequencies (16).
A geographic gene flow model does not, however, explain why the Basque and Finnic language families are outliers both in the ordinations and phenograms, nor why Semitic is an outlier in the extended dataset. These results reflect the distant origins of speakers of these language groups. The Finnic language family is given its unique genetic profile by inclusion of the Lapps. These populations, ethnically different from other Finnic speakers, apparently migrated to northern Scandinavia from northern Eurasia (17). The Basques have long been an isolated enclave, presumably descended from the pre-Indo-European inhabitants of Europe (18, 19). The Semitic speakers have North African origins. These results suggest that some modification of the strictly geographic gene flow model by language origin may provide greater concordance with the genetic relationships between language families.
We conclude that affinities between modern European gene pools have been formed primarily by relatively shortrange gene flow between geographically adjacent populations. Yet, between the speakers of some language families and their geographic neighbors, there are genetic differences that apparently reflect their remote historical and linguistic origins.
FIG. 1. Phenogram based on average unweighted pair-group clustering of average genetic distances among nine language families. Abscissa is average genetic distance. The cophenetic correlation coefficient is 0.842.:
FIG. 2. Three-dimensional ordination based on non-metric multidimensional scaling of average genetic distances among nine language families. The stress is 0.0505. A minimum spanning tree has been superimposed upon the language families. Axes 1, 2, and 3 are represented by width, depth, and height, respectively.:
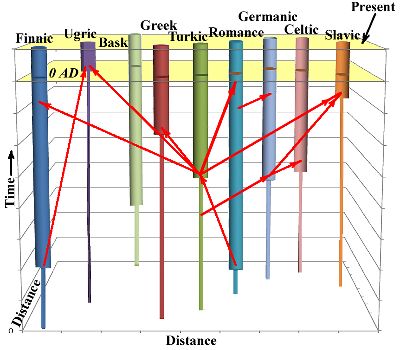
(This graph illustrates relative temporal relations, thin line = proto-language time, same scale)
Last edited by Proto-Shaman; 08-24-2013 at 08:04 AM.


| Thumbs Up |
| Received: 260 Given: 897 |
Slavs should learn some real language
There are currently 1 users browsing this thread. (0 members and 1 guests)
 Posting Permissions


 Reply With Quote
Bookmarks