|
(Chapter VIII, section 2)
In the introduction to the study of the skeletal material, we made only the briefest mention of the statistical methods to be employed in that segment of the book.5 This was done because the numerical size and the nature of the cranial samples employed limited the treatment, in most cases, to a discussion of individual crania and to a comparison of simple means. With the living material however, the use of much larger samples, and of non-metrical soft part criteria, will necessitate reference to more elaborate methods, and therefore a brief allusion to the better known statistical principles and techniques which are commonly employed seems indicated.
Modern physical anthropology, in company with other technical and biological disciplines, has entered a stage of increasing dependence upon mathematics, and lengthy formulae which involve the use of several alphabets are currently employed by most physical anthropologists. Although there are several schools each of which has assembled a favorite collection of symbols, the method as a whole is a product of the English biometric school founded by Galton and Pearson. Aside from the calculation of means. the purposes for which these formulae and numerical techniques are employed may be reduced to four, which, expressed in the simplest possible form, are as follows:
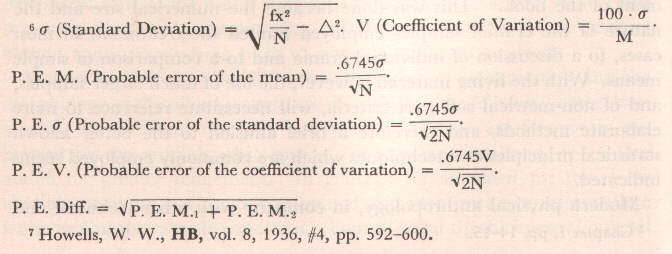
(1) To determine the degree of homogeneity or heterogeneity of a given statistical sample, in the various criteria measured or observed, and to compare it in these respects with other samples. (2) To determine whether or not two statistical samples may be considered random selections from a single population. (3) Having found that the two samples represent demonstrably different populations, to determine exactly how different, in a metrical sense, they are. (4) To determine whether or not a given sample is racially mixed, and if it is, to discover its component elements. Let us review these four purposes and the techniques by which they are accomplished, in as simple and brief a manner as possible. (1) To study the relative variability of samples. This is done by means of the two constants, standard deviation and coefficient of variation.6 The former, in which the variability of the extremes is emphasized by the quadratic treatment, indicates how many unit points the average individual in the sample deviates from that mean. When used to compare approximately equivalent means within the same criterion, it is a simple and useful constant. The coefficient of variation is designed to facilitate comparison between criteria in which the metrical values of the means are quite different, in order to eliminate the size element. By comparing ¤'s [SNPA commentary: this symbol indicates the Greek letter sigma in the original] and V's of a given sample with those of a general compilation, such as that of Howells,7 one may gauge the relative variability of the sample, and may compare it with other specific samples in this regard. This technique is not by its nature limited to living material, but it may be profitably employed with many more published series of the living than of crania. (2) To test the statistical independence of two samples. The second purpose is. in effect, to tell whether or not two samples may be considered separate statistical entities. The technique most commonly employed is to compare the difference between two means with the probable error * of that difference. If the difference is three times or more its probable error, then the two samples are considered distinct in the criterion under study. If, in a large number of criteria, the two samples are consistently distinct, then two separate populations are represented. If, on the other hand, the two samples are not distinct, owing to the relative smallness of differences compared to their probable errors, then we may make one of the following deductions: (a) the two groups represent the same anthropometric population; (b) the two groups are really different, but owing to the small numerical size of one or both samples, or to the excessive variability of one or both, such a difference cannot be established statistically. In order to determine which of these two premises is the more likely, the exercise of judgment must inevitably be interpolated. If both samples are large and of reasonable variability, the two are probably, in fact, alike; if both are very small and the probable errors large, the chances are great that the samples are statistically worthless. The chief utility of the sampling check, therefore, is to find out whether or not apparent differences are really of significance. It is not an automatic proof of identity. (3) To measure the anthropometric difference between samples. The third purpose, to tell how close or how distant two samples are in a metrical sense, may be fulfilled in any one of a number of ways. One is merely to compare the means, and to compute the differences. Then, for convenience, one may pool the differences for separate statistical categories. For example, the difference between sample A and sample B in head length may be 4.35 mm.; in head breadth 7.32 mm.; in head height 1.09 mm. The average difference in three vault diameters is therefore 4.19 mm. The average for the same three diameters, between sample A and sample C, on the other hand, may be 9.73 mm. Therefore we may say that sample A resembles sample B, in the totality of three vault diameters, more than it resembles sample C. Similarly one may pooi the vault indices, or the head and face measurements, or the head and face indices, but one may not average measurements and indices together. To do so would be to commit the kindergarten fallacy of adding oranges and apples. But there are anthropologists who have not only done this, but who have also added centimeters and millimeters together as equal units, in pooling body and head measurements. It has long been the wish of many anthropologists to find some means whereby they might express the degree of similarity of difference between two populations by a single figure. Taking population A as zero, B would be, say, 5.6; C = 7.3; D = 11.9. Thus the relationships of B, C, and D in respect to A could be determined. Taking each of the others in turn. it would be possible to triangulate and to plot the mutual relationships of any number of populations in a simple, graphic manner. Morant, working with a formula invented by Pearson, has proposed and employed such a method in the form of the coefficient of racial likeness.8 Some have accepted this in principle, others have rejected it.9 Whatever its theoretical validity or error, however, it does actually give approximately the same results as a simple pooling of the several categories of differences. Unfortunately neither a simple pooling nor the coefficient of racial likeness takes into account correlative influences which compel several characters to vary in concert, and thus to weight, in a variable degree, the totality of characters chosen. According to Morant, these correlative influences could be eliminated, but only by an unfeasible amount of statistical labor. Before proceeding to the fourth purpose, let us pause to make a few reflections upon the uses to which the three systems already outlined may be put. Although all are useful, not one automatically answers any important questions. The first technique, that which is concerned with variability, tells us how variable samples are, but not why they are variable. Unusual variability may indicate an active evolutionary tendency, the recent and as yet not fully amalgamated mixture between two populations, or any one of a number of other causes. Unusual homogeneity, on the other hand, does not necessarily mean racial "purity," in the historical sense, but rather a complete amalgamation and a static evolutionary condition. The second is useful mainly to eliminate from serious consideration statistically inadequate samples. The third gives a detailed idea of degrees of metrical similarity and difference. But neither the second technique nor the third tells the investigator what is the genetic relationship between two samples. (4) To analyze a racially mixed sample. Let us now turn to the fourth and last important use which the physical anthropologist makes of statistics. This is his attempt to divide a given sample, which he considers to have resulted from a mixture of races, into its component elements, and to see what these elements are and how much there is of each in the mixture. This is a rather complicated process, and many different methods have been devised to accomplish it. One is the system employed by Hooton and his school, in which the author was trained. That is for the anthropometrist, working either with crania or with the living, to divide his series into what seem to him natural groupings, and to specify on each measurement blank which of these types is represented. After the sample has been seriated as a whole, the sub-samples of the different types are seriated separately, and statistically compared with each other and with the total mean. By this means it may be determined whether or not statistically different elements have actually been isolated. If so, the next step is to determine, by comparison, what the larger racial relationships of these elements are.10 Hooton bases his system on the principle that the individual possesses a racial identity, as well as does the group to which he belongs. Another method which is less subjective but wholly arbitrary is that of Czekanowski, who plots the mean differences between individuals in a sample on a chequered field; this is done only with indices of the head and face, when the original system is followed.11 Two individuals alike in all indices chosen produce a black square at the point where their lines intersect; two which are less alike produce a square which is striped, in varying degrees arranged to show the degree of similarity; then those which are dissimilar in all indices are represented by white squares. After these squares have been completely plotted, the graph is rearranged so that those which are naturally related are placed in contiguous positions. In this way it is possible to see how many sub-groups of naturally correlated individuals occur, and how large these sub-groups are. The next step is to find the racial affinities of each sub-group. For this purpose the Polish school has designated a formal list of races, each symbolized by a separate Greek letter, and each equipped with a list of ideal metrical positions in the more commonly used measurements and indices, as well as with a characteristic pigmental position. Each group of correlated black squares in the graph is assigned to one of these races, or to a combination of two or more, and the percentages of each race in the sample is thus worked out. A third method is that originated by von Eickstedt, the leader of the Breslau School, and amplified by Schwidetzky.12 This method is to sort the sample directly into sub-series by splitting the distribution frequencies of the characters at arbitrary racial boundaries, and by combining the results of this process as applied to pairs of characters; to plot the distribution curves of the sub-series, so-created, for measurements, indices, and percentages of observations; and to test the sorting by a comparison of these curves with others which represent arbitrary racial norms. Like all such systems, this one operates on the assumption that the result of mixing A + B in any metrical character is 2 The three methods outlined above are all based on the principle of correlation. Correlation statistics alone are even more commonly used than any of these. One may correlate metrical characters with each other; metrical characters with indices; either metrical characters or indices with observations, and observations with each other. By means of these correlation statistics one finds which characters are associated, in the sense that their variations are not mutually independent. One finds, for example, that light eyes are usually if not always correlated with light hair. The elements of blondism are to a certain extent linked. One will also find that segments of a dimension are positively correlated with that dimension, but this is of no racial significance. If they are not correlated, or are negatively correlated, then there is something to investigate. One must furthermore expect all gross size diameters to be intercorrelated to some extent in any population, for obvious reasons. Correlations of racial significance are those which are not dependent on gross size and are not involved in a part-and-whole relationship. Thus, if tall stature goes with blond hair and short stature with dark hair, or if a broad nose goes with a low relative sitting height, and vice versa, then the anthropologist who is analyzing his series assumes that he has uncovered linkages showing racial variations within his sample. There is no possible objection to the use of correlations, but there are many objections to the ways in which they are often interpreted. In the first place, a valid correlation implies some degree of genetic linkage. But it does not necessarily imply that this linkage represents with complete fidelity a combination found in one component element in a hypothetical mixture. There may have been no mixture at all - the group may be evolving, by mutation, in a certain direction which involves more than a single character. Or if there has been mixture, the correlation may represent a recombination of characters. Correlation, in brief, shows linkage, but what does linkage mean? We must not forget that a population, in the physical as well as in the social sense, has an existence of its own in addition to and above the existences of its component units, and we must not, furthermore, anticipate the findings of the geneticists. All of the methods which partition a series, or which employ the principle of correlation, have some justification in their initial steps, and some utility, but all of them become unscientific as soon as general biological principles are forgotten and arbitrary assumptions are allowed to creep into the process of interpretation. At this point we must repeat the premise upon which the whole technique of the present book is based: The study of race in man is as much a social and historical as a biological discipline. Out of his environment man creates his cultural milieu, and his cultural milieu, as we are becoming increasingly aware,13 alters his physical nature. When we shall have discovered some of the laws which govern human inheritance and human change, we may become much more mathematical than is fitting at present. Laws in biology and in its sub-division sociology, when once understood, are seen to be as invariable and as valid as laws in physics. But we cannot, and we should not attempt it, remove the study of human racial taxonomy from the dimensions of cultural milieu and of history. We may and must employ a statistical method, but let it be one tempered with simplicity and discrimination, since mathematics to us is not an end but a tool.
5 Chapter I, pp. 14-15. 6
|
|
* See footnote 6 on preceding page. 8 Morant, G. M., Biometrika, vol. 14, 1923, pp. 193-264; vol. 16, 1924, pp. 1-105. 9 Fisher, R. A., JRAI, vol. 66, 1936, pp. 57-63. 10 Hooton, E. A., The Ancient Inhabitants of the Canary Islands; Indians of Pecos; Science, vol. 63, 1926, p. 75. 11 Czekanowski, J., MAGW, vol. 42, 1912, PP. 17-217; AASF, ser. A., vol. 25, #2, Helsinki, 1925; AAnz, vol. 5, 1928, pp. 335-359. 12 Eickstedt, E. von, ZFRK, vol. 2, 1935, pp. 1-32. 13 Cf. the title and sense of Ohilde's book, Man Makes Himself. |